

Overview
Every query, command, and API call that flows through Formal Connectors is logged and stored for auditing, compliance, and security analysis. Formal’s log system provides comprehensive visibility into data access across your organization.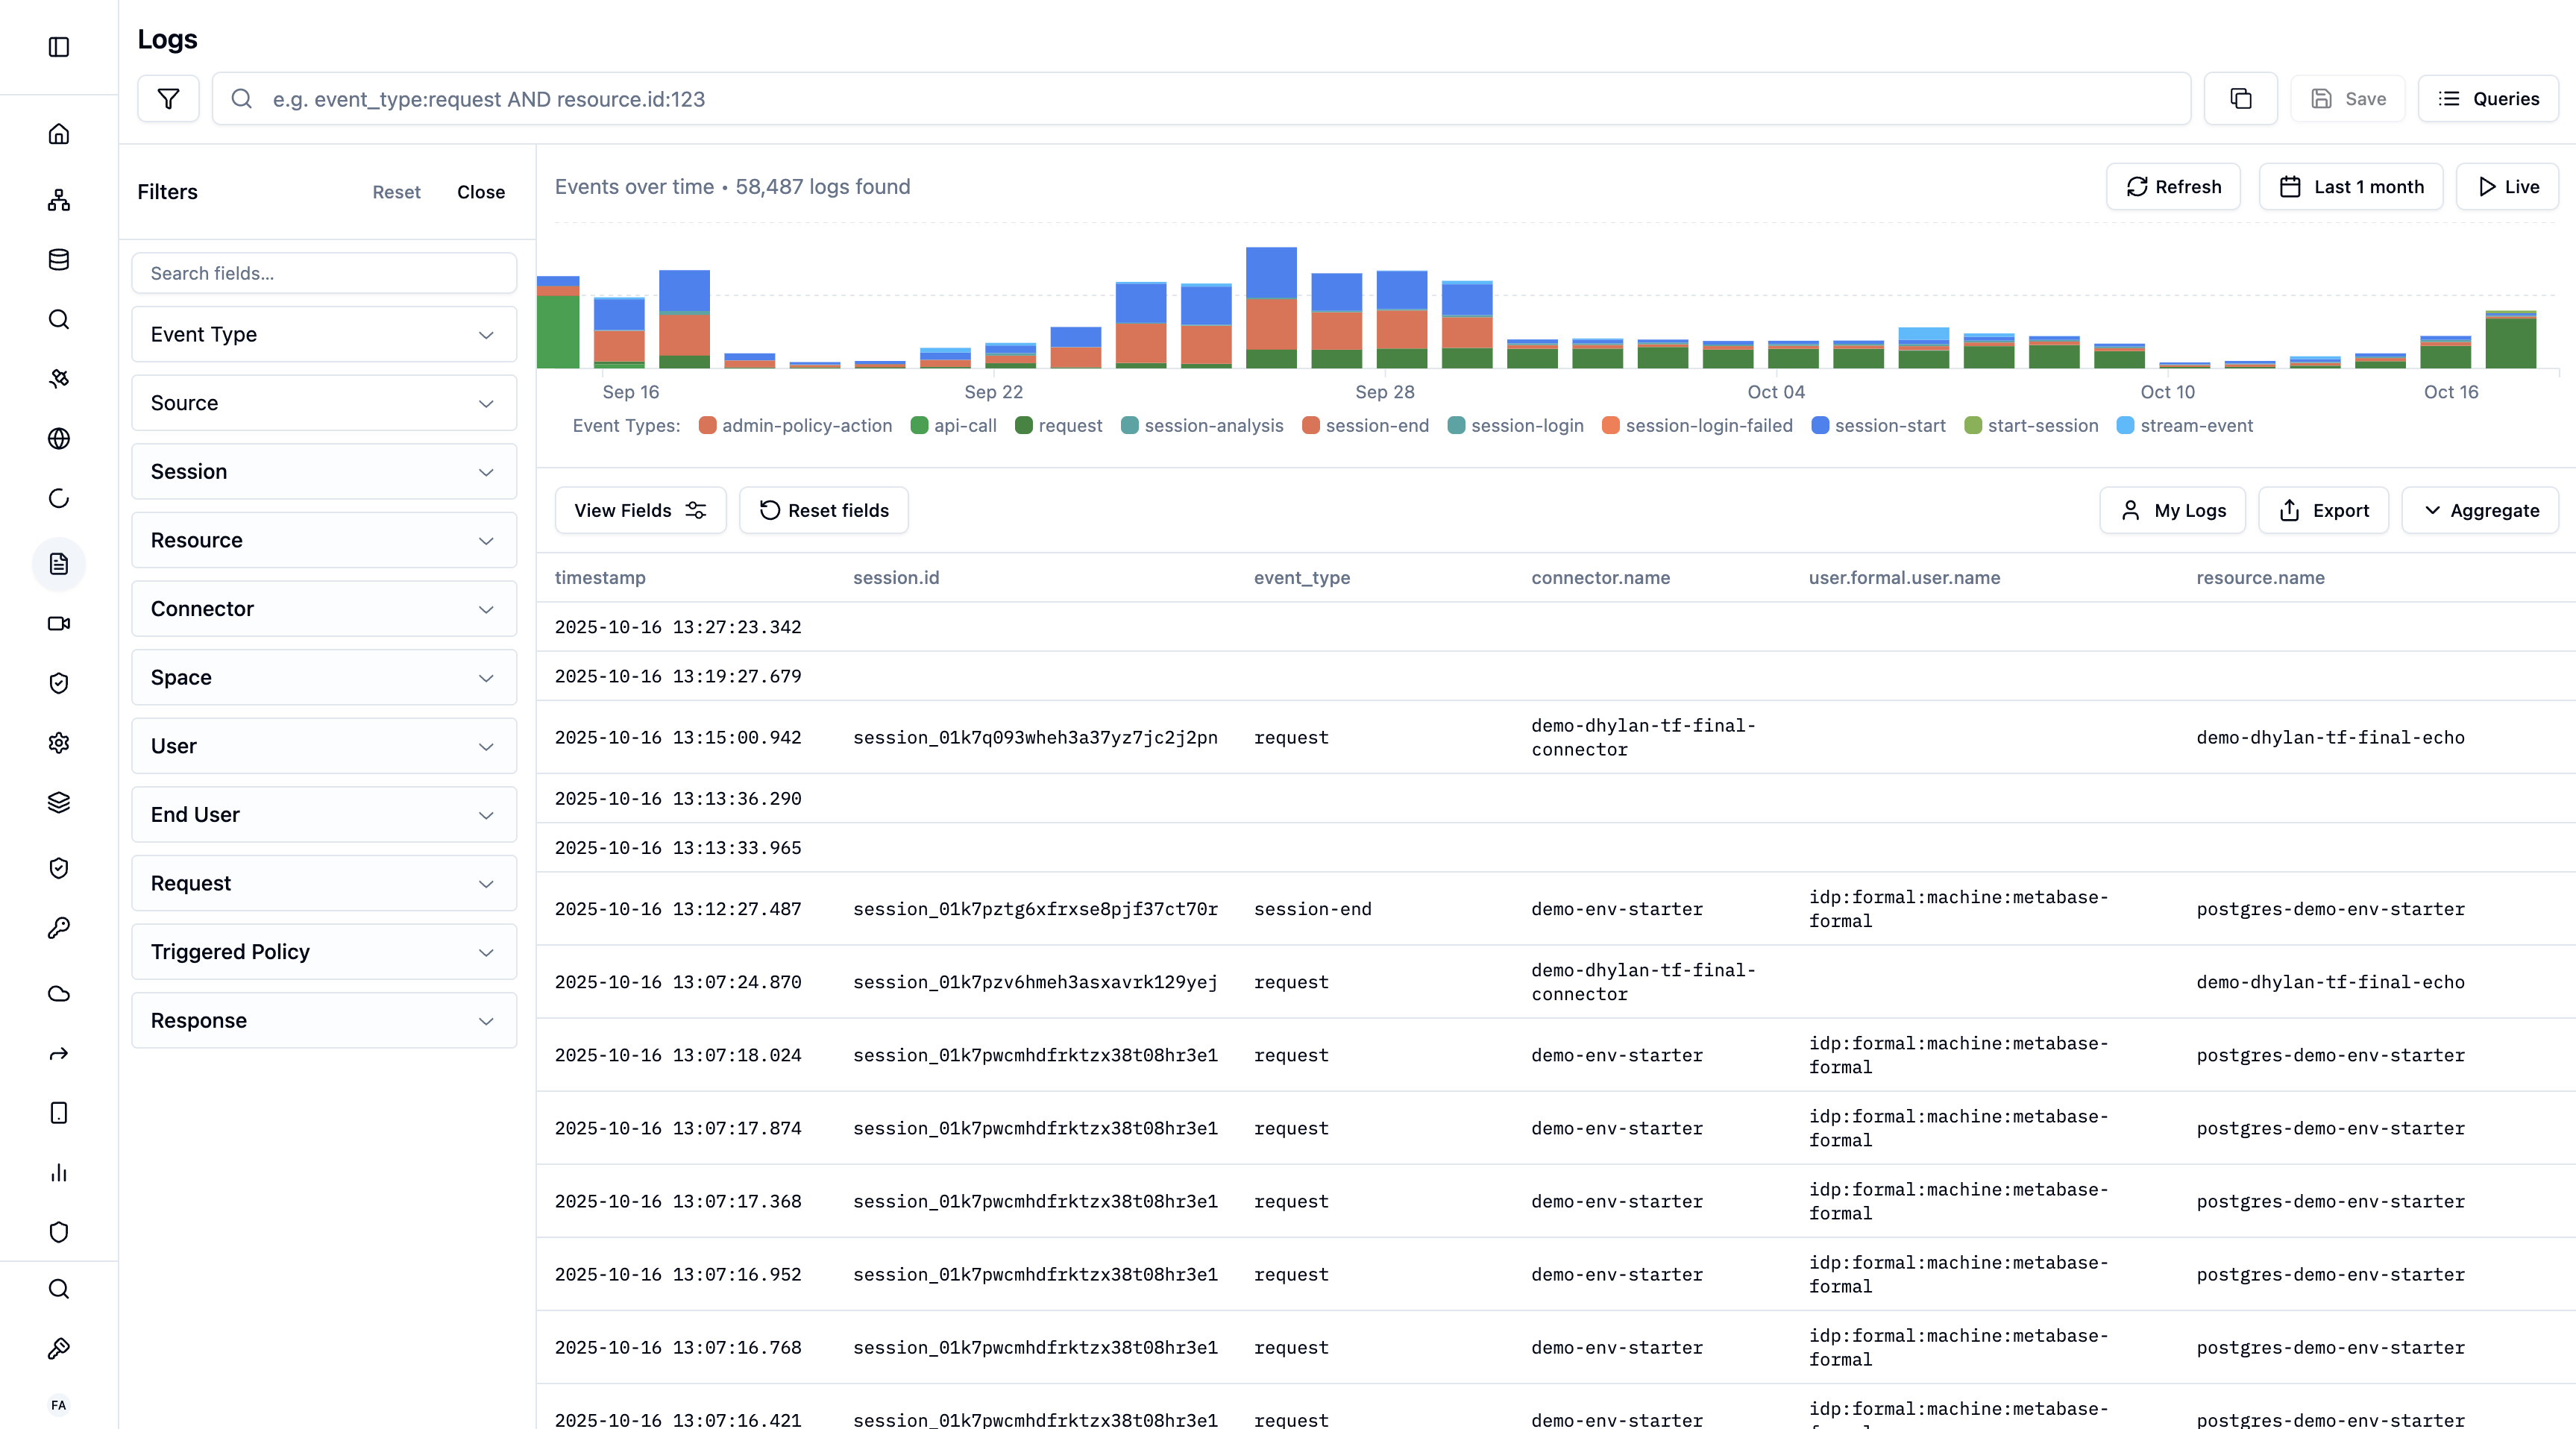
What Gets Logged
Database Queries
Full SQL/NoSQL queries, execution time, rows affected
API Calls
HTTP requests, headers, request/response bodies, status codes
SSH Commands
Every command executed in SSH sessions
Kubernetes Exec
kubectl exec sessions and commands
Log Enrichment
Formal automatically enriches each log entry with contextual information:| Field | Description |
|---|---|
| Timestamp | When the query/command was executed |
| User | Formal user who made the request |
| End-User | Actual end-user (for BI tool queries) |
| Resource | Target database, API, or server |
| Connector | Which Connector processed the request |
| Session ID | Associated session identifier |
| Policy Actions | Any policy enforcement (mask, block, filter, etc.) |
| Client IP | Source IP address |
| Application | Client application (psql, Looker, etc.) |
| Duration | Query execution time |
| Rows Affected | Number of records touched |
Accessing Logs
Navigate to Logs in the Formal console to view all logged activity.Viewing Modes
- Logs Mode
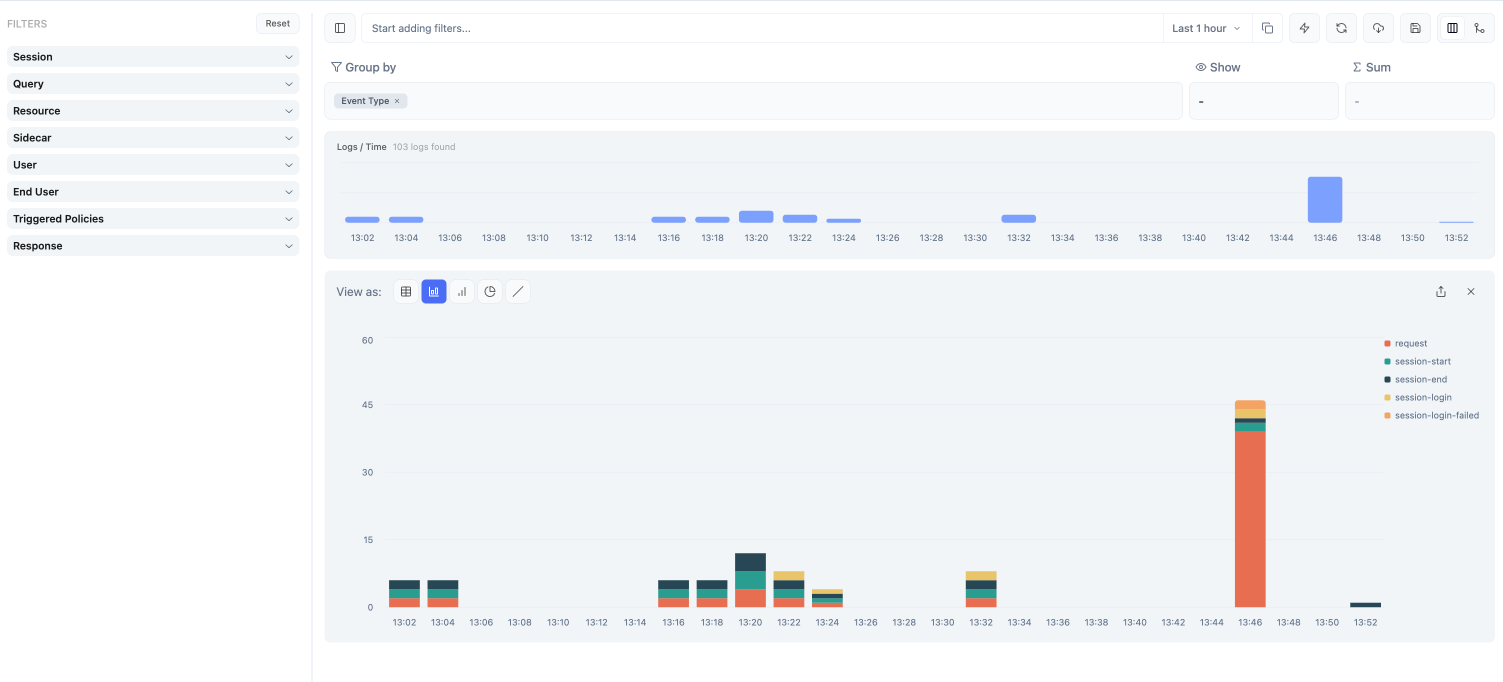
- Aggregation Mode
Default view that displays all log entries chronologically. - See
individual queries/commands - Click any row to open detailed panel - Filter
and search across all fields - Export to CSV
Log Details Panel
Click any log entry to view comprehensive details: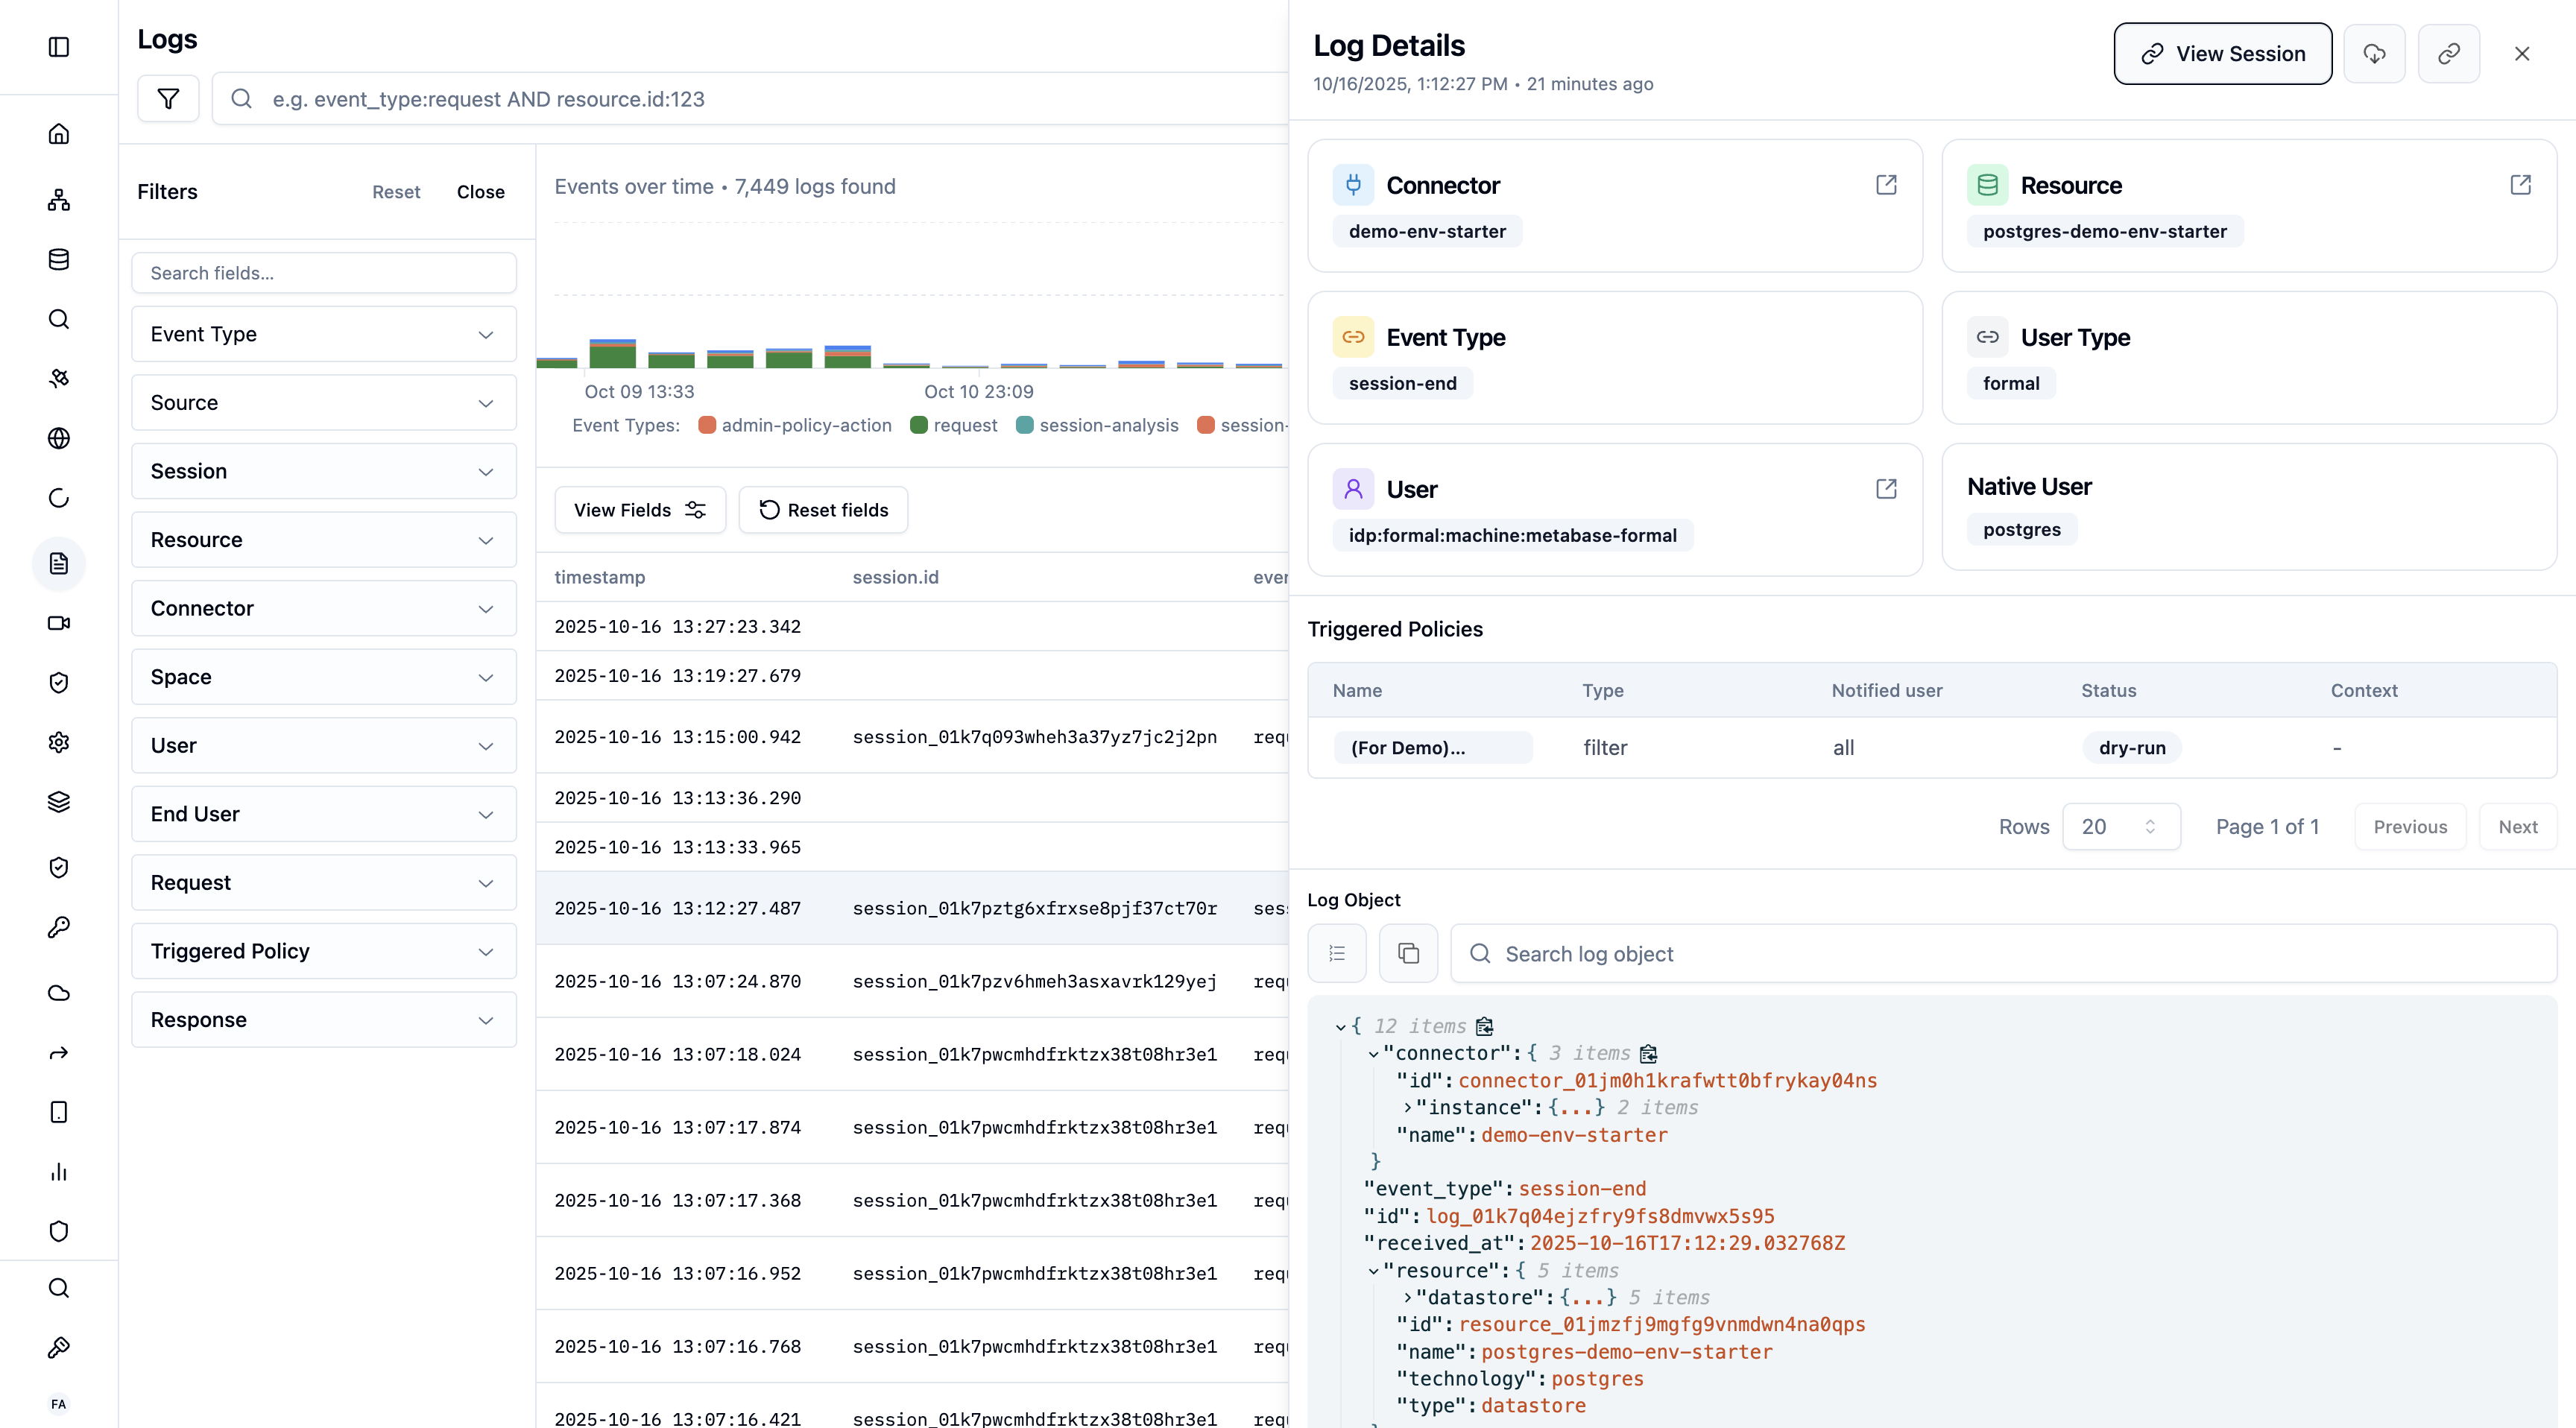
What’s Included
- Full Query/Command: Complete text of what was executed
- User Context: User, end-user, groups, email
- Resource Information: Database, hostname, port, technology
- Policy Evaluation: Which policies evaluated, actions taken, reasons
- Performance Metrics: Duration, rows affected, data transferred
- Network Information: Client IP, application, connection details
- Session Link: Jump to associated session recording
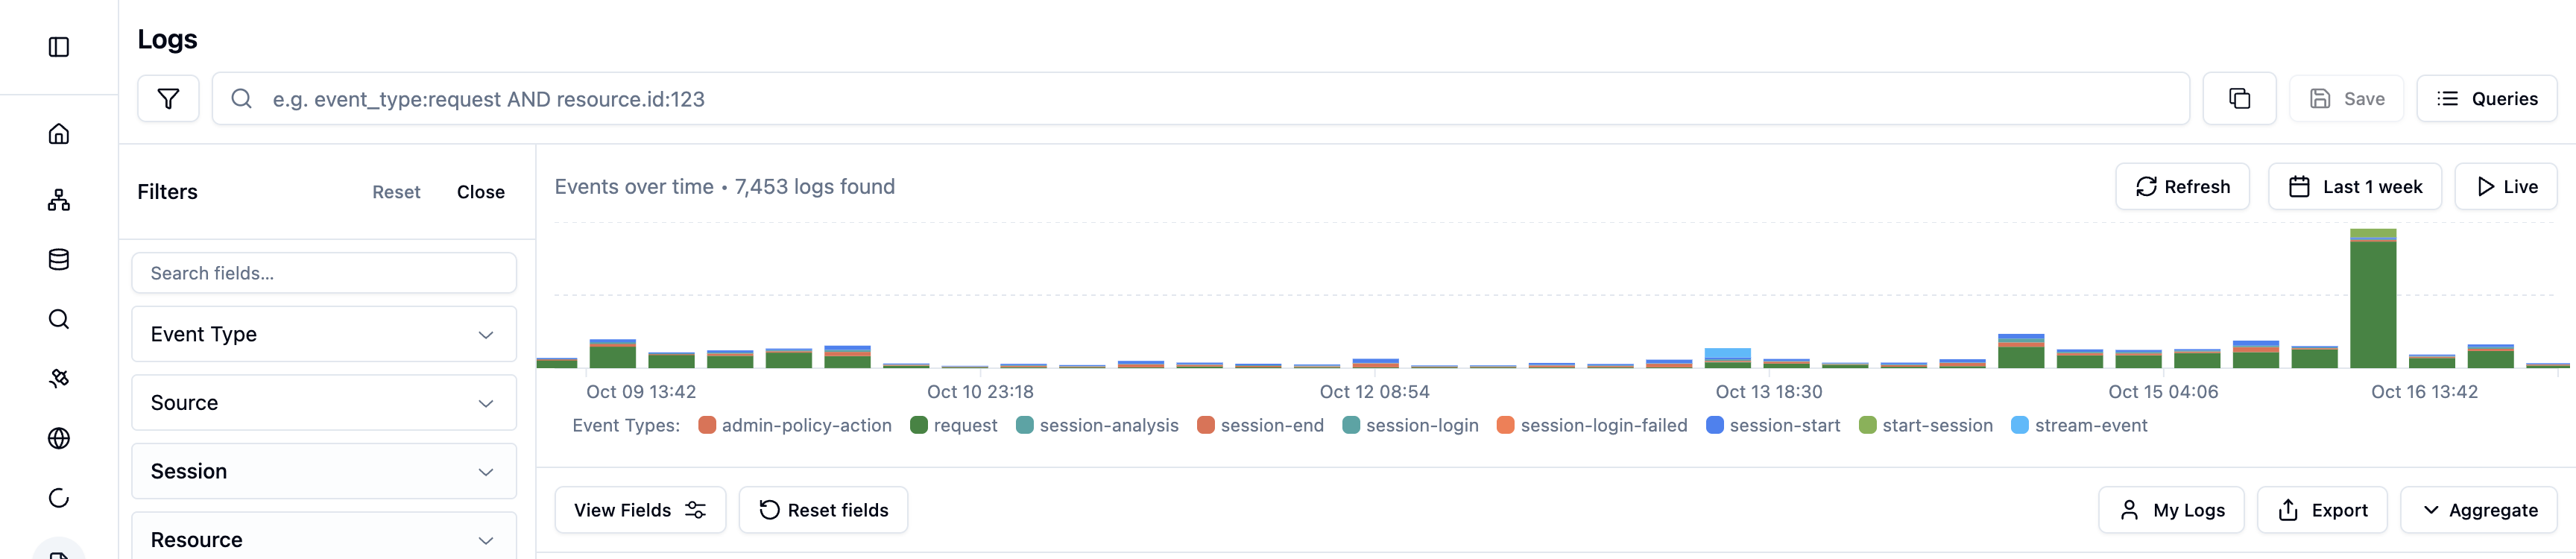
Filtering and Search
Formal uses Quickwit query engine for powerful search capabilities.Basic Filters
Use the sidebar to filter by:- Connector
- Resource
- User
- End-user
- Group
- Technology (postgres, ssh, http, etc.)
- Time range
Advanced Search
Write Quickwit queries for complex searches:Query Templates
Formal provides pre-built query templates:| Template | Description | Query |
|---|---|---|
| Formal Users | System-generated users | user.type:formal |
| Native Users | Queries using native credentials | user_type:native |
| Triggered Policies | Logs with policy enforcement | policy_actions:* AND NOT policy_actions:allow |
| Datastore Queries | Database queries | technology:(postgres OR mysql OR mongodb OR snowflake) |
| HTTP Requests | API calls | technology:http |
| S3 Requests | S3 operations | technology:s3 |
| Encrypted Requests | Queries with encryption | request.query.encrypted:true |
| SSH Sessions | Terminal sessions | technology:ssh |
Query Library
Recent Queries
View your search history:- Click Queries to open the Query Library
- View the Recent tab (default)
- Select any previous query to re-run it
- History persists across sessions
Saved Queries
Save frequently used queries for quick access:- Create your query with filters or search terms
- Click Save in the toolbar
- Name your query
- Access later from Queries → Saved tab
Template Queries
Pre-built queries for common use cases. Click Queries → Templates to browse available templates (see Query Templates above)Exporting Logs
CSV Export
Export search results to CSV for offline analysis:- Apply filters or search query
- Click Export to CSV
- Download the file
SIEM Integration
Forward all logs to external systems:- AWS S3: Long-term archive, compliance storage
- Datadog: Real-time monitoring and alerting
- Splunk: SIEM integration
- Elastic: Centralized logging
- Sumo Logic: Security analytics
Best Practices
Save Common Queries
Save Common Queries
Save frequently used searches for compliance, security, or operational
monitoring.
Set Up SIEM Integration
Set Up SIEM Integration
Forward logs to your SIEM or data lake for advanced analytics and long-term
retention beyond Formal’s console.
Regular Audits
Regular Audits
Schedule weekly or monthly log reviews to identify unusual patterns, policy
gaps, or security incidents.
Use Aggregation Mode
Use Aggregation Mode
Leverage aggregation and visualization to spot trends that aren’t obvious in
individual log entries.
Monitor Policy Triggers
Monitor Policy Triggers
Regularly review logs where policies blocked or masked data to ensure
policies are working as intended.
Policy Evaluation Input Retention
Formal can optionally retain the input data that was available to policies during evaluation. This enables policy backtesting - the ability to test new or modified policies against historical access patterns.What Gets Retained
The fullinput object that is passed to policies at a particular evaluation stage will be retained.
Refer to our policies evaluation docs to learn more about what is passed
as input.
Configuring Retention
Configure retention periods independently for each evaluation stage in your Log Configurations:- 0 days (disabled): No policy inputs are retained in the Control Plane
- 1-30 days: Policy inputs are stored for the specified duration
Integration with Policies
Policies can enrich logs with contextual information:reason and contextual_data fields appear in the log entry, providing audit trail context.